Weekly Adda #2
Significance of 'last seen' on WhatsApp, challenges of using UPI for new internet users and access to toilets in Indian schools.
INSIGHT 💡
WhatsApp ‘last seen’ and the boss!
"Last seen" and the blue ticks are crucial in blooming romantic relationships. So much so that leaving someone on reading is now internet slang, meaning the recipient has read but has not responded. Though these data points might look like features, they can alter how you perceive a relationship in the real world. In one such instance, we met someone who changed his WhatsApp settings, fearing his friends and boss.
He was a machine operator in a factory, and I was researching to understand people's perceptions of privacy. We asked if he had ever changed his settings on WhatsApp. He replied that he had recently turned off his "last seen" set, fearing his boss and few friends would spy on him. He received interesting video forwards in groups and friends throughout the day, and the participant had a habit of watching them till late at night. His last seen timestamp gave away when he would have potentially slept the previous night. He feared that one day his boss might accuse him of staying awake late at night if he ever turned up late for work. He also had a friend who would mock him for his behaviour of staying up late to watch videos. He finally managed to turn off the setting to avoid a friend's remarks and potentially getting scolded by his boss.
His story illustrates how seemingly innocuous features can have a real-life effect. More importantly, it could violate privacy and impact people's self-esteem and relationships. Therefore, online platforms must give users control over the kind of data they want to share.
WEEKLY READ 📖
How might we make UPI apps intuitive and trustworthy for new internet users?
Dvara Research and Centre for Social and Behavioural Change conducted a study with new UPI users to understand the challenges while using digital payment apps. The study aims to uncover perceptions, behaviour, and knowledge of conducting financial transactions through an app. The study was conducted among 262 respondents across Kerala and UP. The target segment covers women, migrant workers and gig economy workers.
The study has two parts: a survey and a qualitative study. The results from the quantitative study are released at the moment.
Download the PDF | Read about the study
A few exciting graphs caught my attention
1. Where did the respondents first hear about the app?
2. What were the common use cases of payment apps?
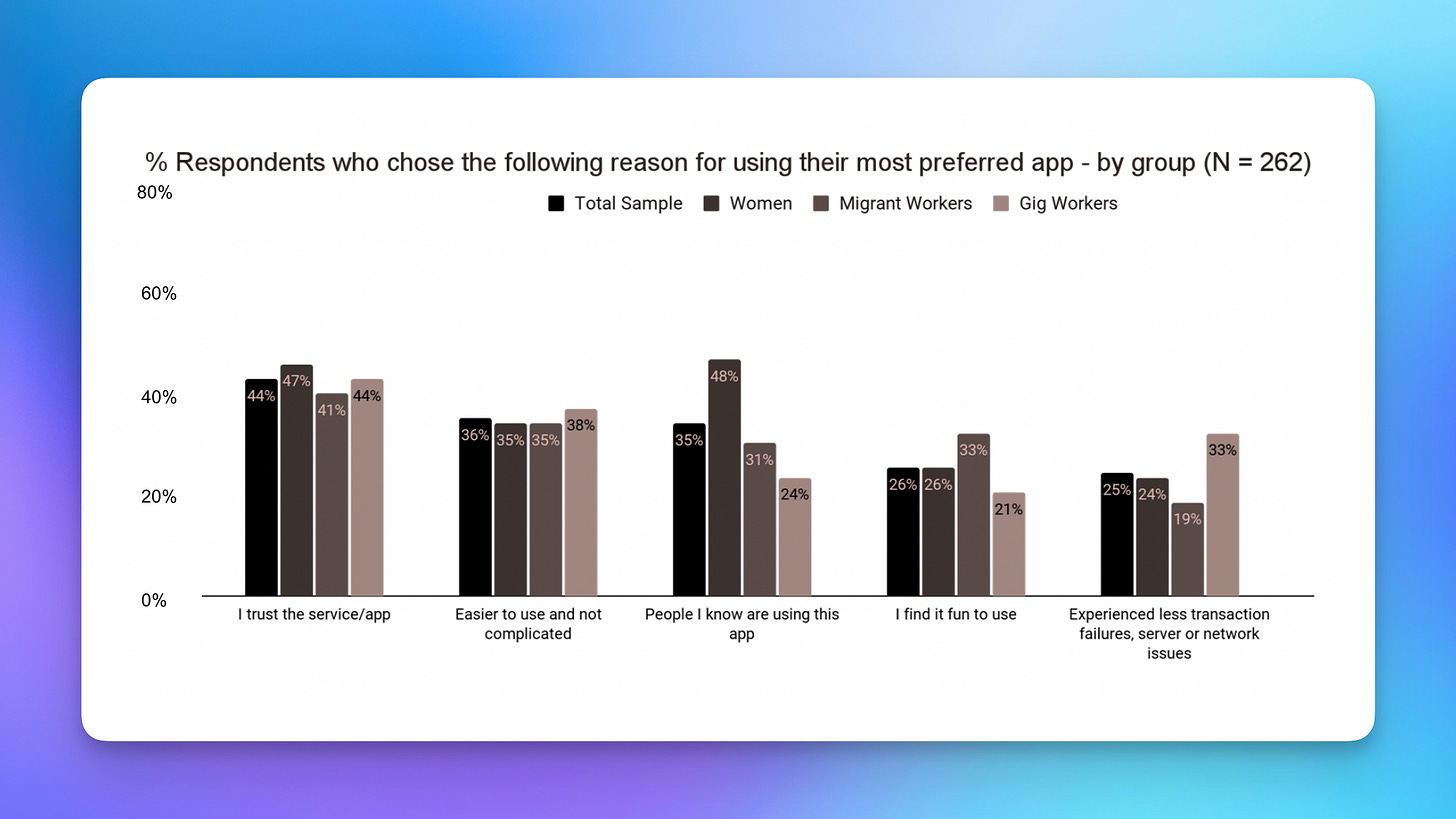
3. What are the reasons for using a specific (UPI) payment app?
4. Respondents who faced fraud while using the payment apps?
5. Top 5 challenges faced while using the payment apps?
6. Top modes of a transaction while using the payment apps?
DATA VISUALISATION 📊
What percentage of schools don’t have a functional toilet?
A beautiful visualisation by Stats of India on the access to toilets across schools in India.


That’s all I had for today. Follow me on Twitter for more notes on Indian consumer behaviour.


Thanks for featuring our study (DR-CSBC UPI Study), I can assure you the team worked v hard on it! :)