Where do Indians invest their money? 💸
In 2017, RBI published a landmark report on Indian household finance. This report discusses the financial behaviour of Indians compares this behaviour across major countries of the world. In this post, I'm shall deconstruct the asset allocation of Indians.
What is an asset?
An asset is something that provides a current future economic benefit for an individual. (Source: Investopedia)
This report classifies the assets held by Indian households as the following.
Real Estate (Commercial and residential buildings or land.)
Gold (Jewellery, bullion (i.e.) gold bars, ornaments and coins.)
Durable Goods(Transportation vehicles, livestock/poultry, agricultural machinery and non-farm business equipment.)
Financial assets (Bank deposits, publicly traded shares, government securities, mutual funds, informal loans receivables.)
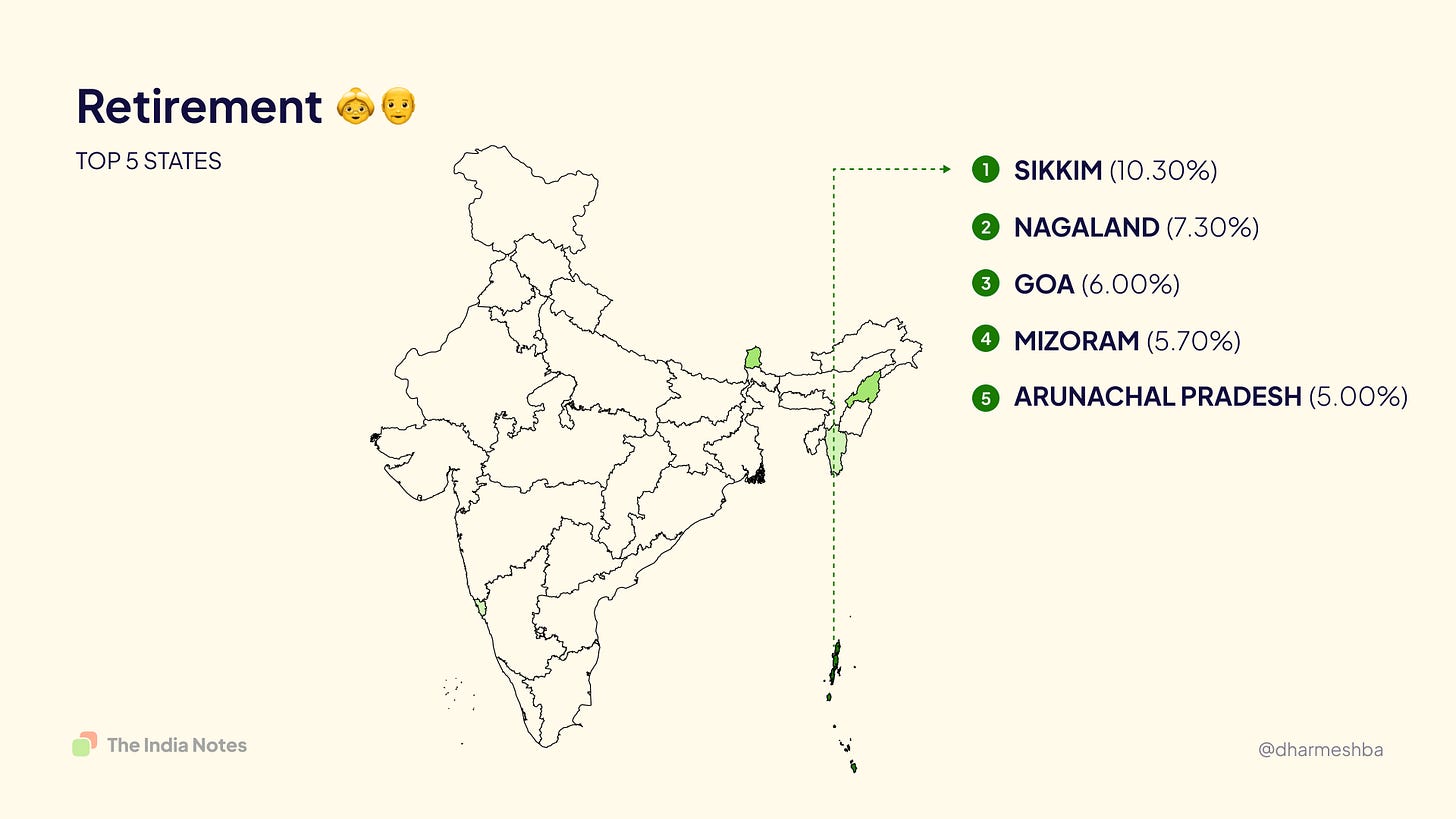
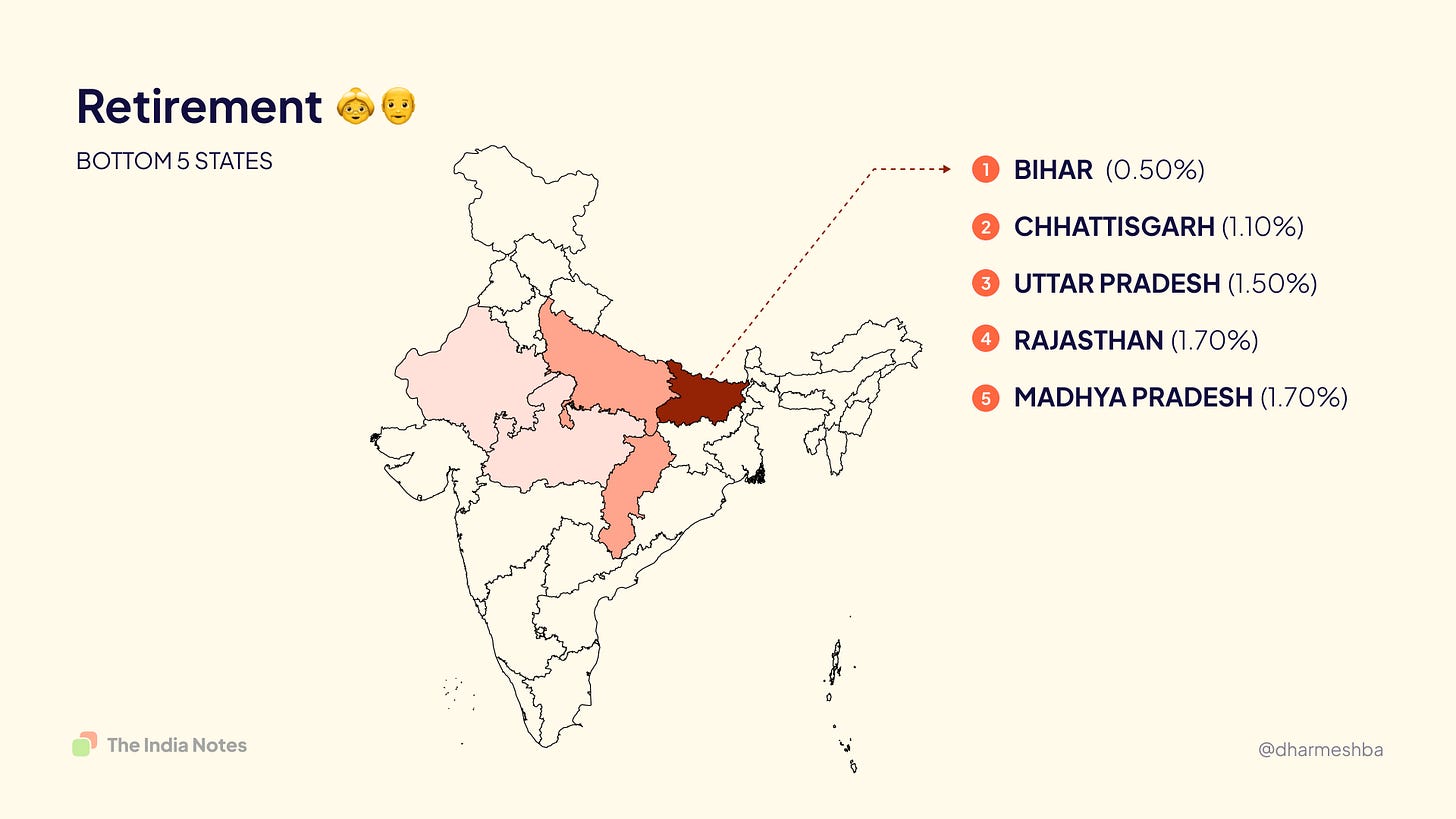
Retirement savings (Private pension accounts, provident funds, annuity certificates, life insurance accounts.)
Most of these asset types are tangible assets, also known as physical assets that can be touched and felt. The rest of them are intangible assets that exist in a paper or a digital form.
Indians hold 95% of their assets in the physical form. For example, an individual with a net worth is Rs. 100 hold Rs. 95 is in physical assets like real estate or gold, and only Rs.5 is invested in financial investments like the stock market or mutual funds.
If we dive a little deeper, we realise that real estate dominates by a vast margin. It occupies 77% of Indians' balance sheet. As Indians, we are taught to save our money through generations, but it looks like that money goes predominantly into physical assets. Though physical assets have less volatility than financial assets like mutual funds and stock markets, their long term returns barely beat the inflation in most cases. In addition to this, liquidity is a huge problem, especially in real estate.
But is this overarching love for physical assets common only in India? The report compares the assets held by citizens across countries, and it gets more interesting. The report compares the assets across these seven countries. In this graph, the x-axis plots various countries, and the y axis denotes the percentage of the asset type held by the households of the corresponding countries.
Highlights from the comparison:
Indian's love for real estate beats other countries by a considerable margin. China comes second.
Interestingly Indians have the least allocation in durable goods compared to others, with Thailand topping the chart.
In no other country other than India, gold made it to the household balance sheet and no wonder that Indian households hold more gold than many other countries.
Indians have minor allocations in the asset balance sheet in both financial assets and retirement accounts.
Asset allocation across age:
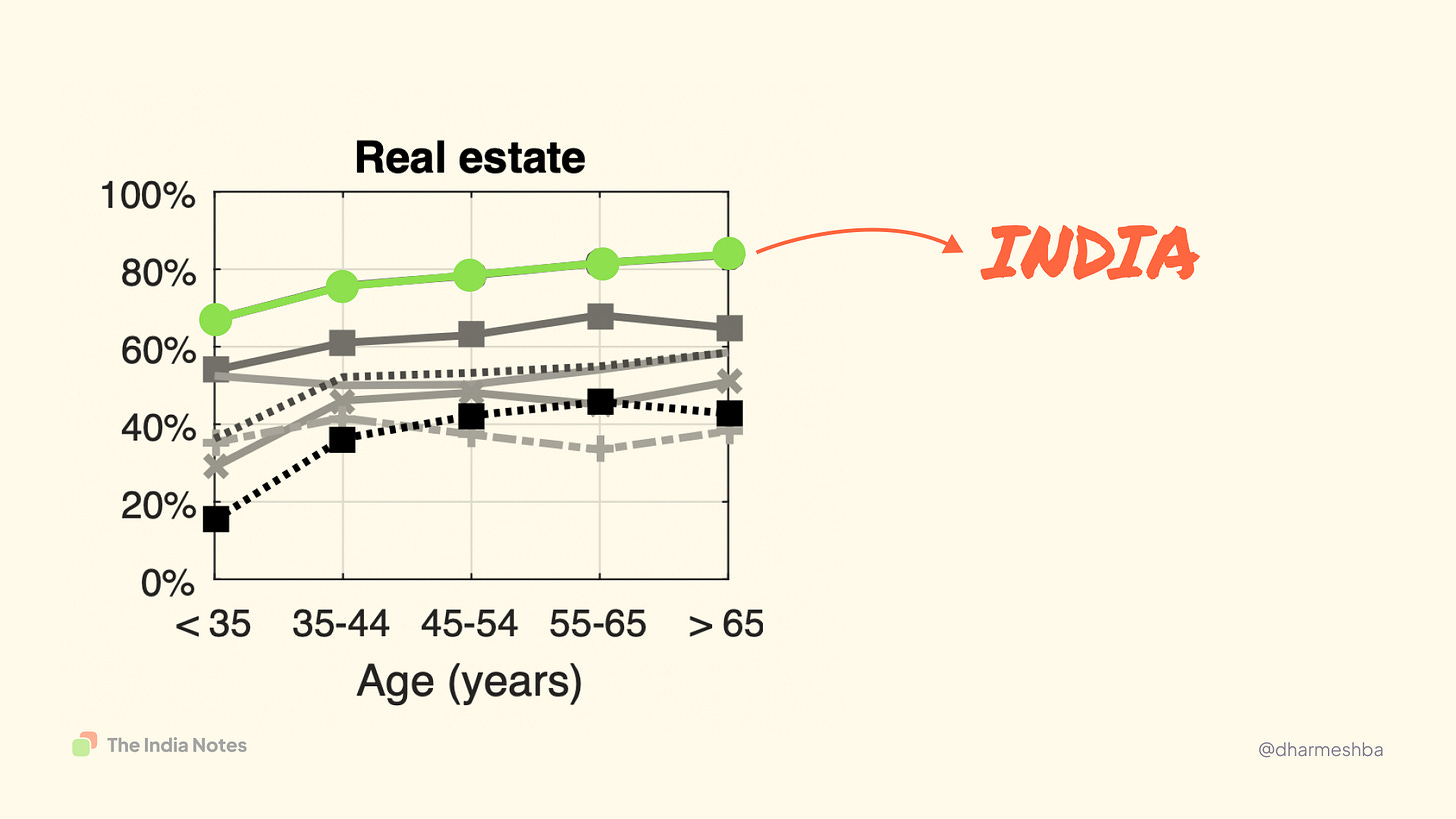
When I saw this graph for the first time, I wondered if the data would be different for the younger generation, given the awareness about mutual funds and the stock market has increased in recent times. But I was pleasantly surprised when I saw this graph which plots the allocation of various assets across age groups. You could see the real estate allocation is higher across all age groups, and it consistently increase with age. At the same time, you could see the distribution of financial assets decreasing with age.
Asset allocation across wealth distribution:
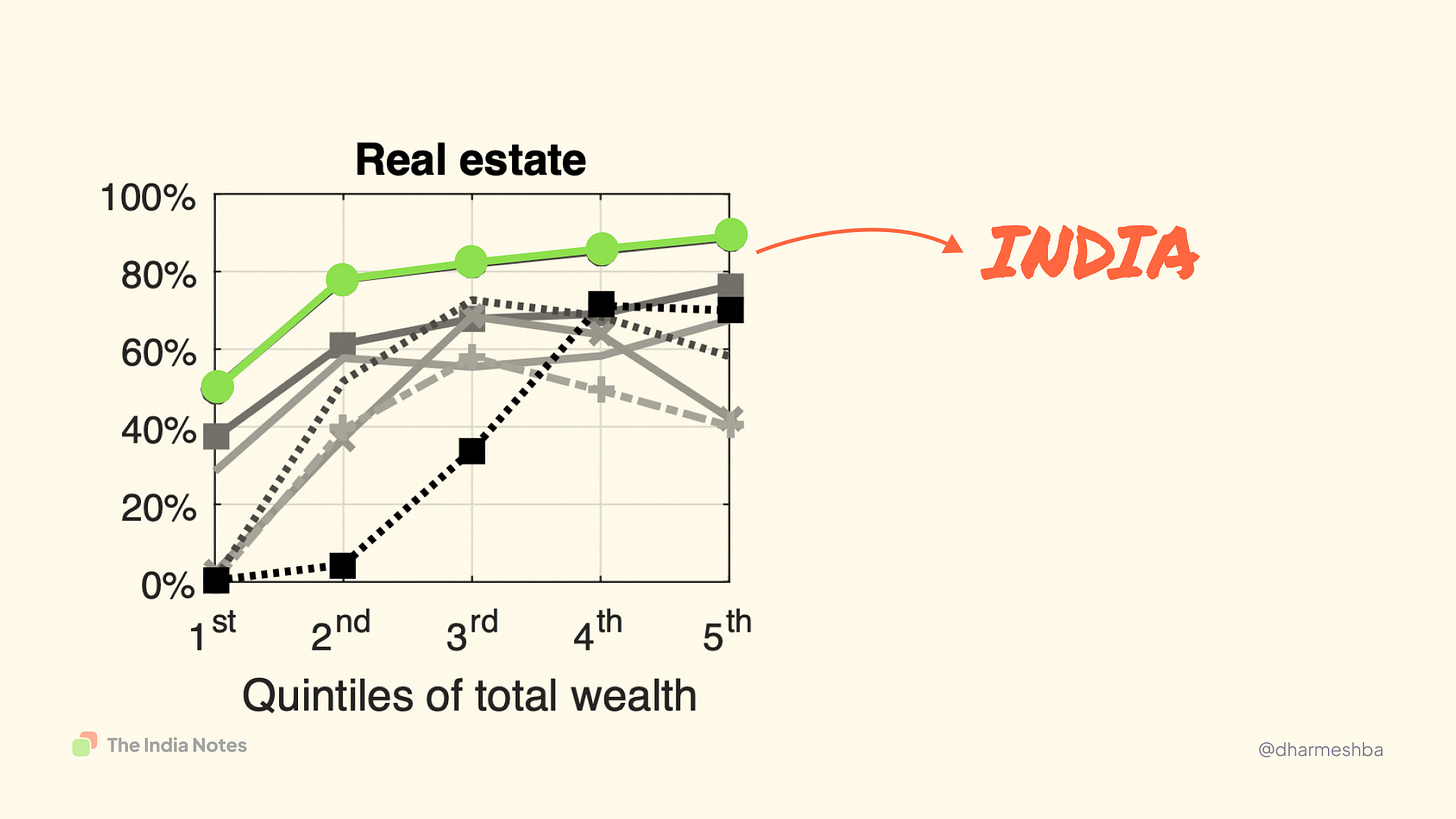
Like the US has an aspirational American dream, Indians consider buying a home and gold as a middle-class dream. It's not just the middle class who aspire to buy homes. The real estate allocation in the portfolio remains higher even in poorer and more affluent households. This graph plots the allocation across different categories of wealth. Here the 1st quintile represents the lower-income group, and the 5th quintile represents the higher income group. In fact, the richer you are, the higher your real estate allocation is.
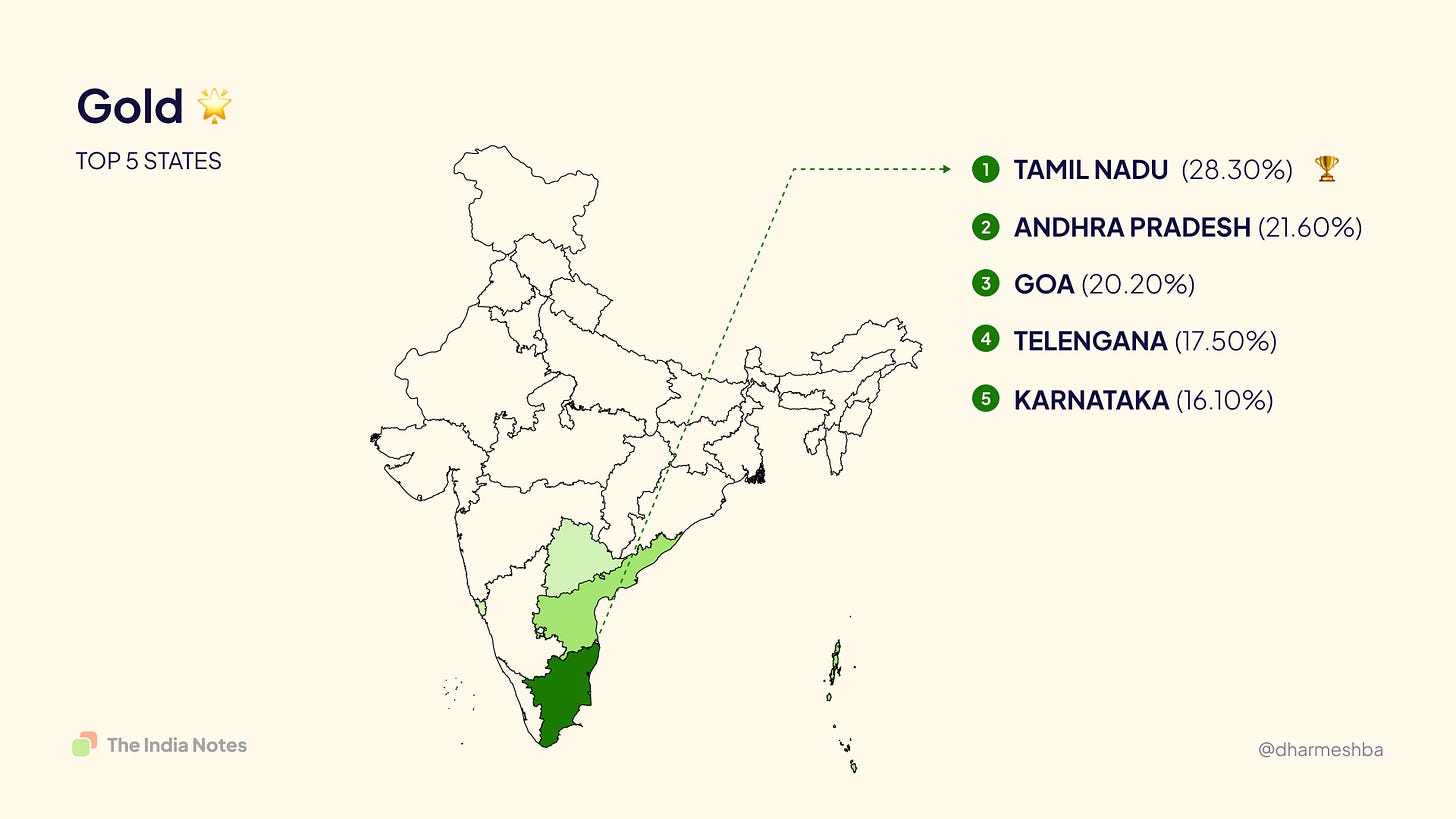
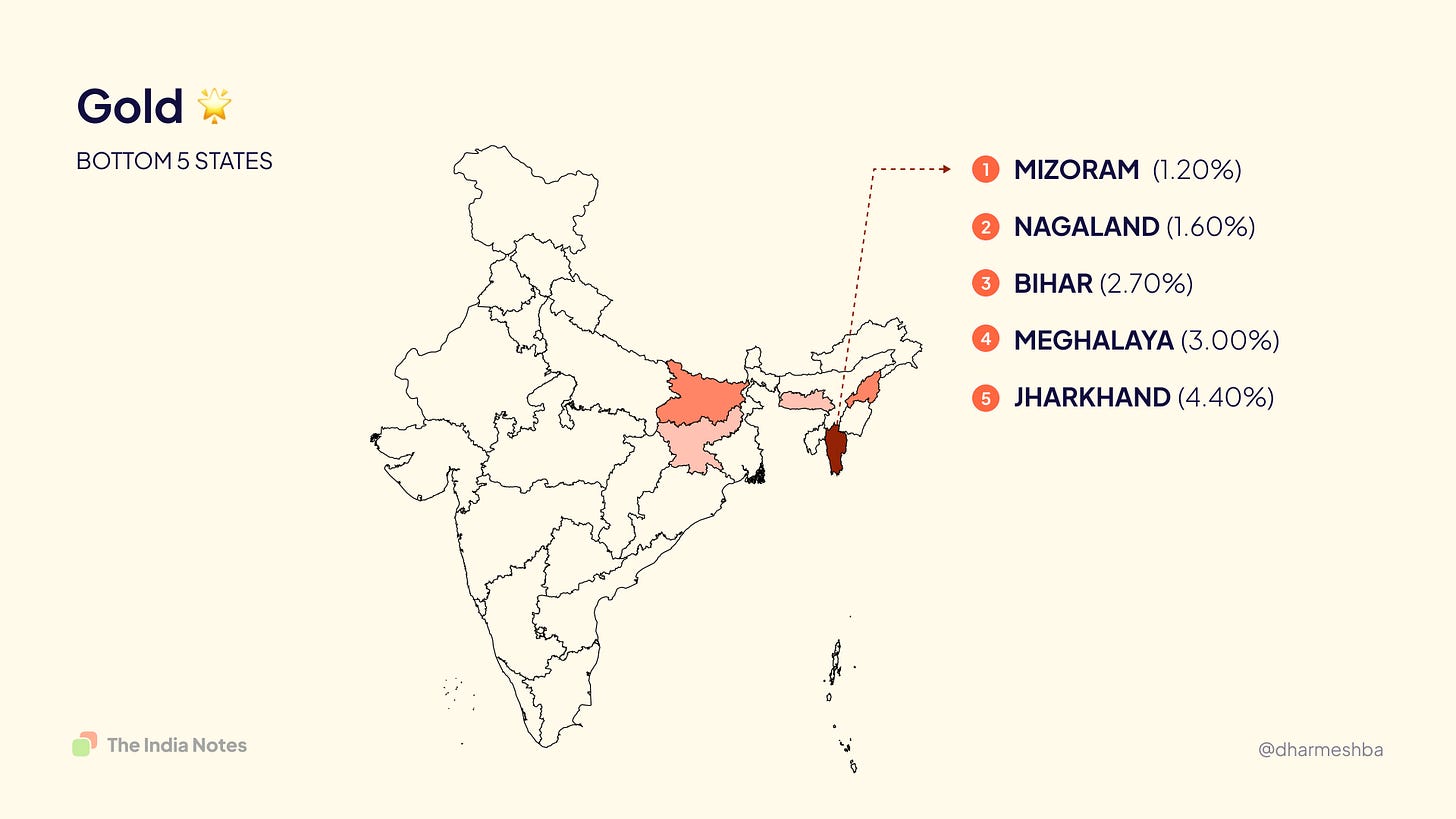
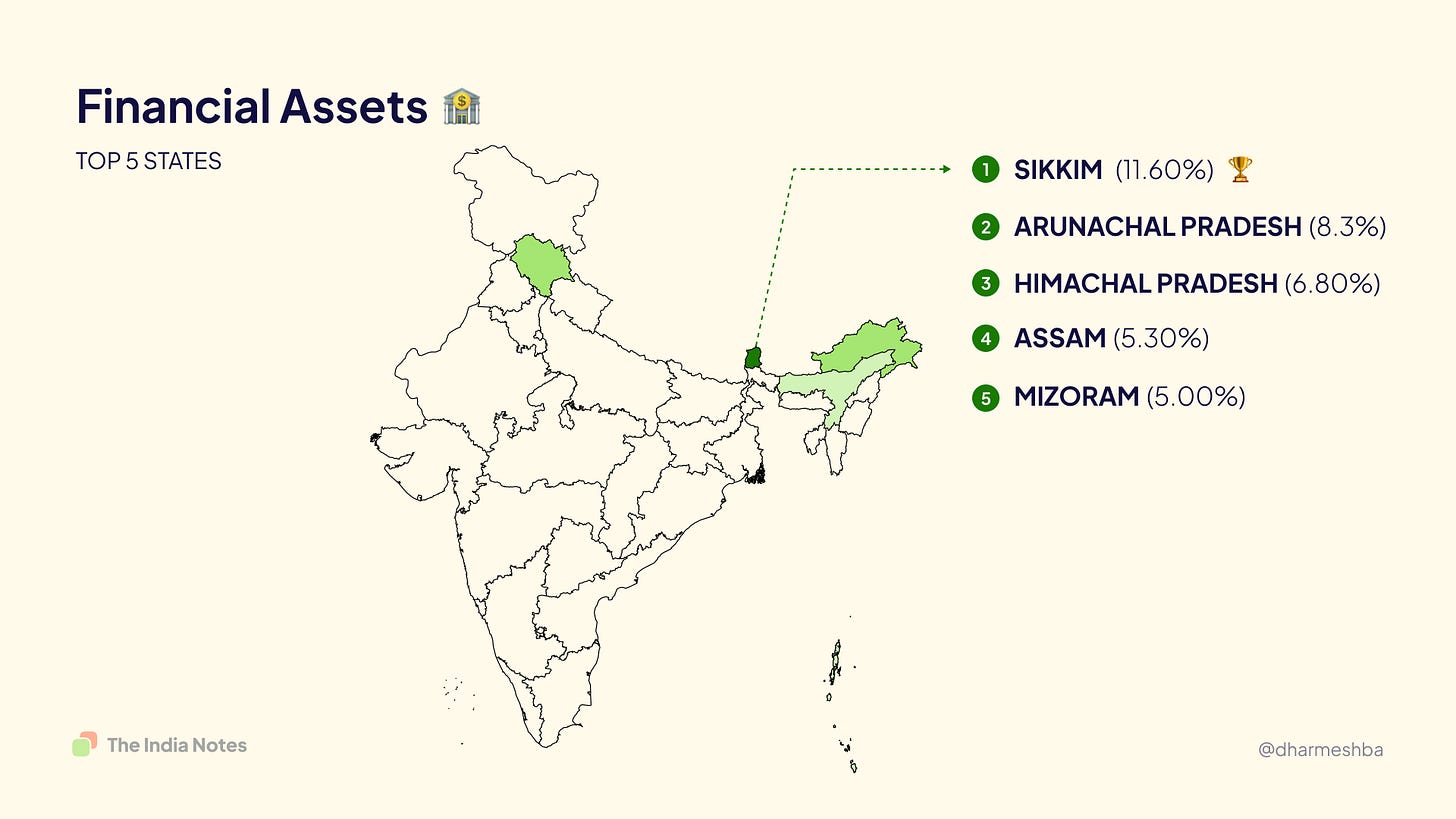
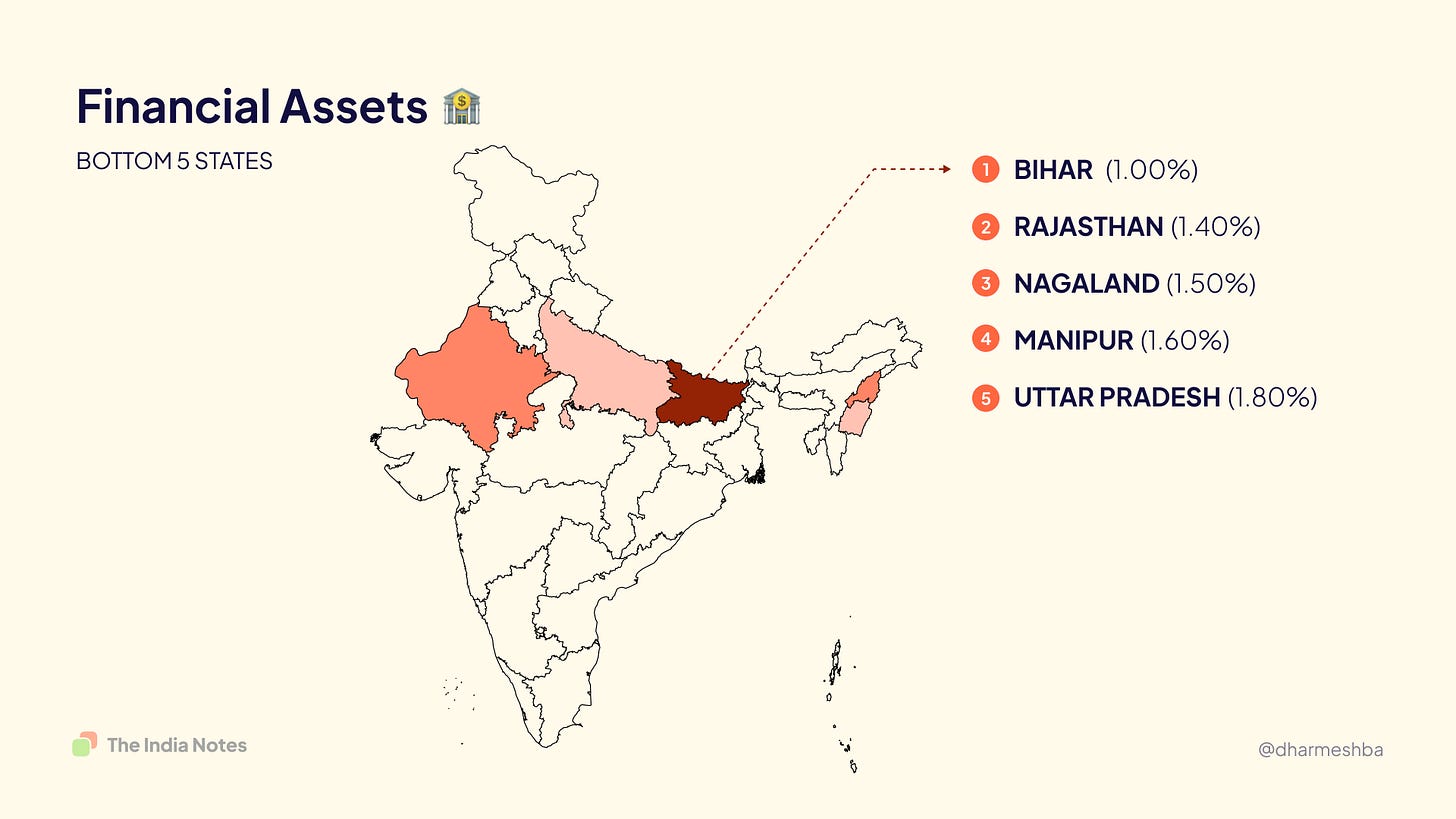
India is a rich and diverse nation with multiple states, cultures and languages. How would it be fair to group them all under one bucket? Right. I dug into the report to find the state-wise asset allocation, and I visualised them. Let's look at how asset allocation differs in individual states.
Allocation across different Indian states
Real Estate
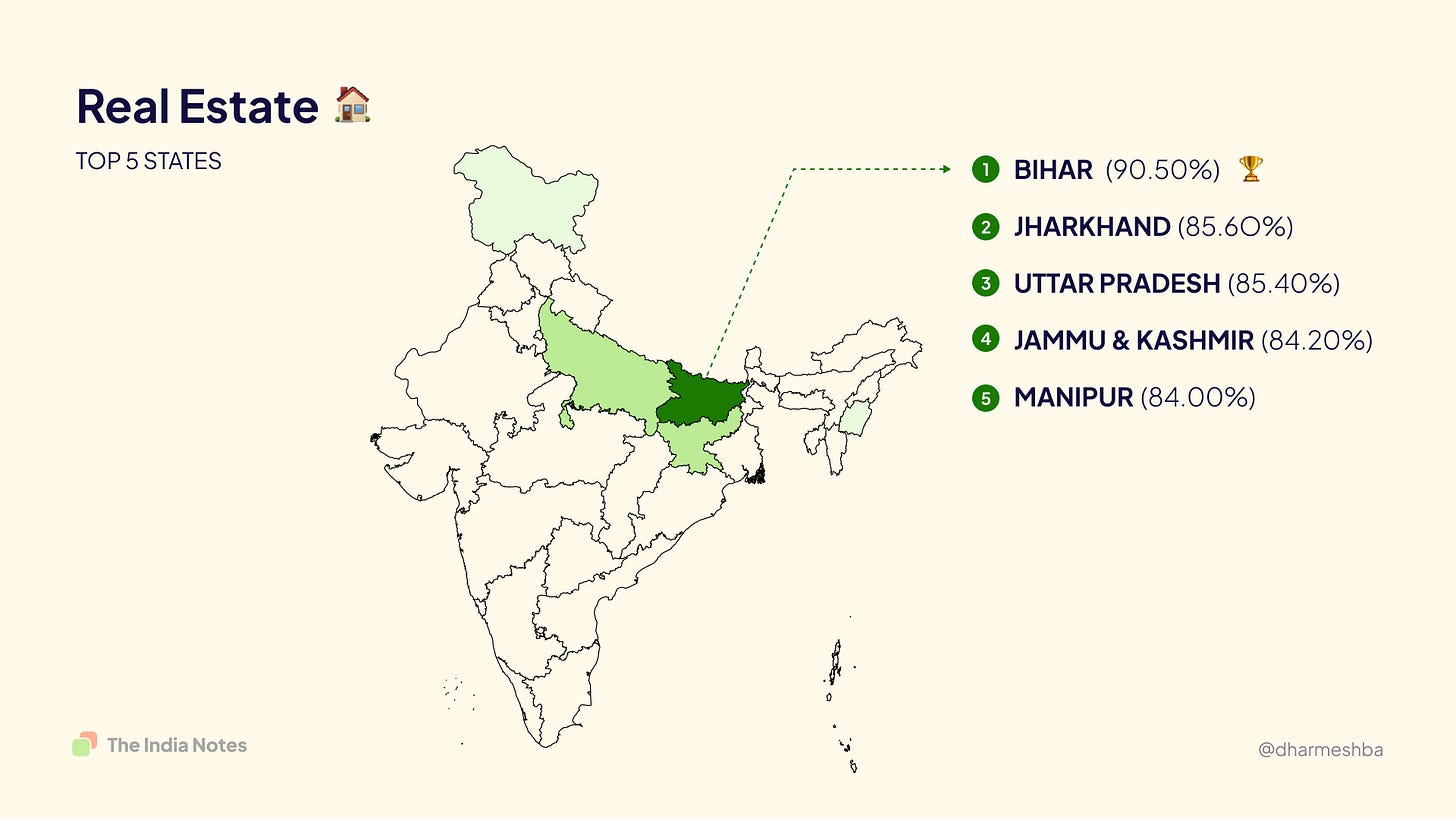
Bihar tops the chart. On average, the state population holds 90.5% of their money as real estate assets, including lands, residential and commercial properties. The Northern part of the country seems to prefer real estate to others.
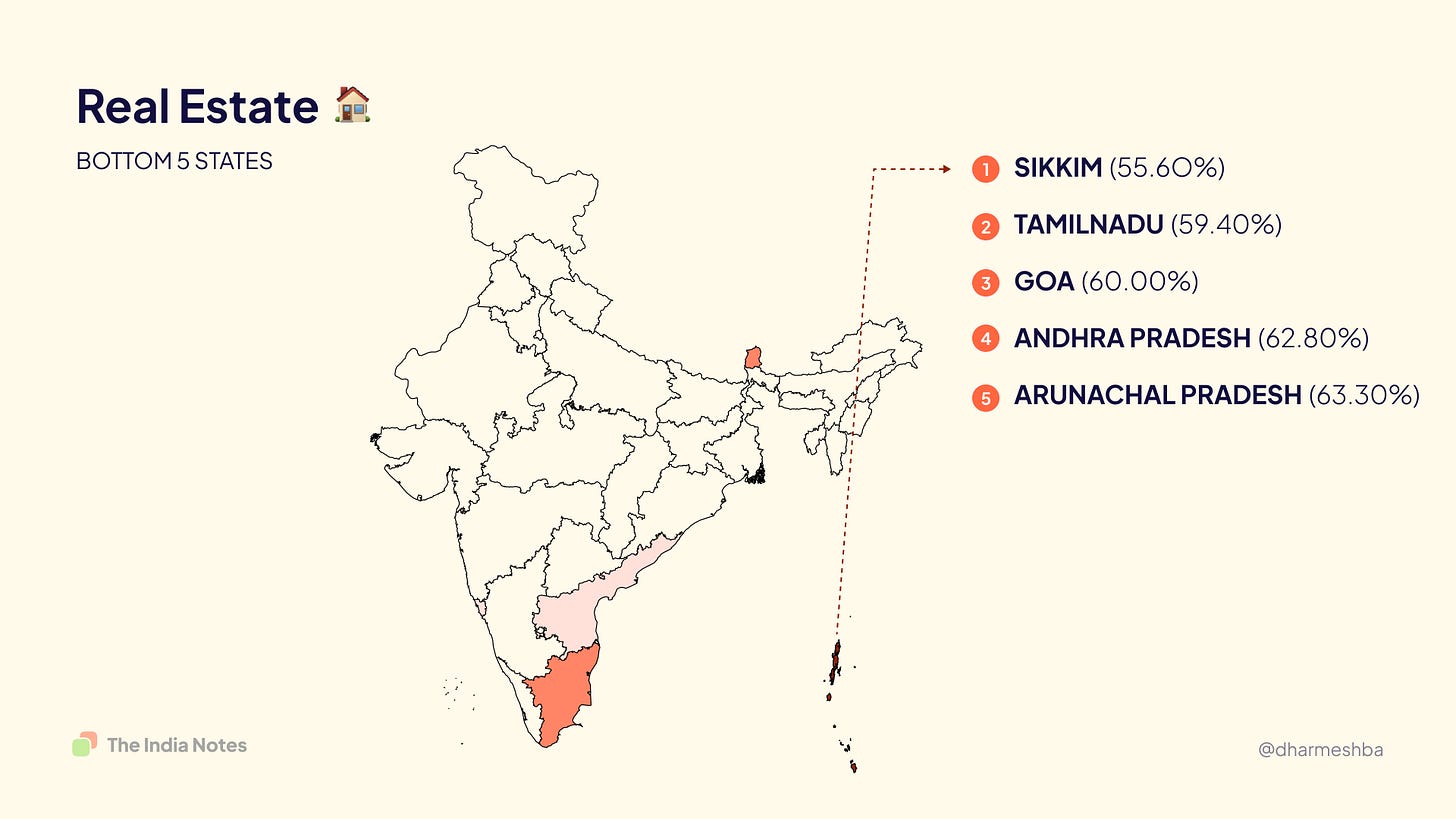
When it comes to lowering real estate investment, Andaman comes last, with Sikkim, Tamilnadu, Goa and Andhra Pradesh following them.
Gold:
Financial assets:
Retirement Accounts:
What does this mean for India?
Indians need to diversify beyond physical assets and invest in financial instruments such as the stock market and mutual funds. I believe this is where India's fintech apps will make a massive difference to the economy through access and education.
Data source: RBI Household Finance Report, 2017
You could also watch the video made on this topic on my Youtube channel - The India Notes.
This is an opinion piece on design, and I am happy to hear your perspective on the post. If you find this interesting, do share it among your peers.


